Rate this article :
This article was useful to you ?
Yes
No
Vous avez noté 0 étoile(s)
Sommaire
Procédure
cPanel allows you to track the use of CPU resources and simultaneous connections. You can also track the memory, CPU and I/O (disk access) consumption of your Web hosting package.
At LWS, each customer has their own resources. This means that if one customer uses a lot of resources, this will have no impact on other customers on the same server. For this reason, each cPanel package has a"CPU usage" tool that shows the resources that can be used and are used by these websites. Thanks to the graphs provided on the cPanel packages, you can monitor the actual consumption of your hosting package and also see if the limit is likely to be reached quickly.
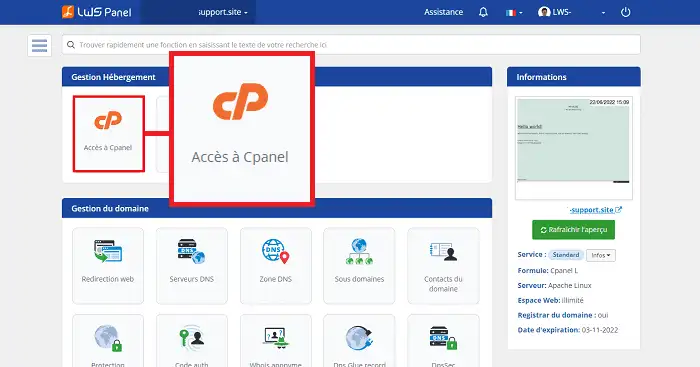
2. Then click on the"Resource usage" button in the"Measurement" section.
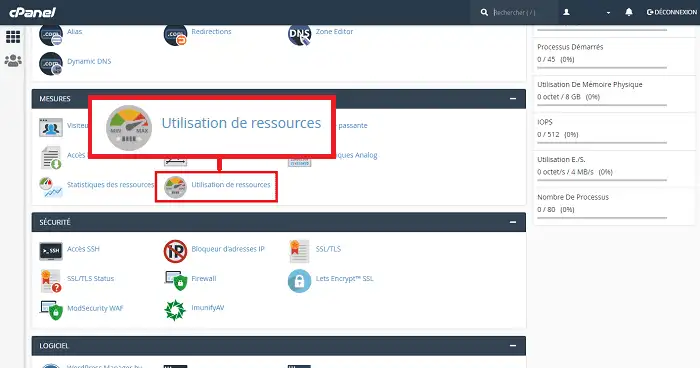
Once you have clicked on the"Use of resources" tab, the first page will tell you whether certain limits have already been reached by your plan.
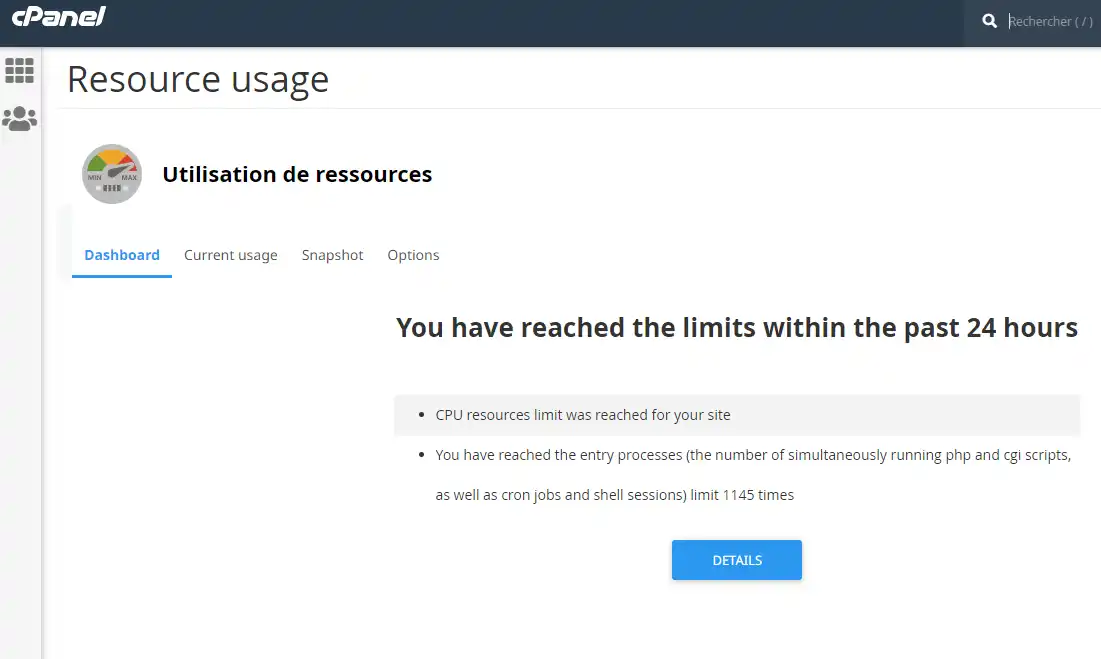
This last page often indicates that certain quotas, such as I/O or CPU, have been exceeded over the last 24 hours. This is often normal. You may have run a heavy script or imported a site to consume all the resources available on your package.
On the other hand, it can be considered abnormal to consume all the resources more than 50% of the time. This is often a sign of a malfunction in your site or a PHP script.
There are two tabs on the CPU usage page:
If you would like to have information about consumption over the last 24 hours or 7 days, click on'Current Usage'.
You will see various graphs such as CPU, I/O and processes.
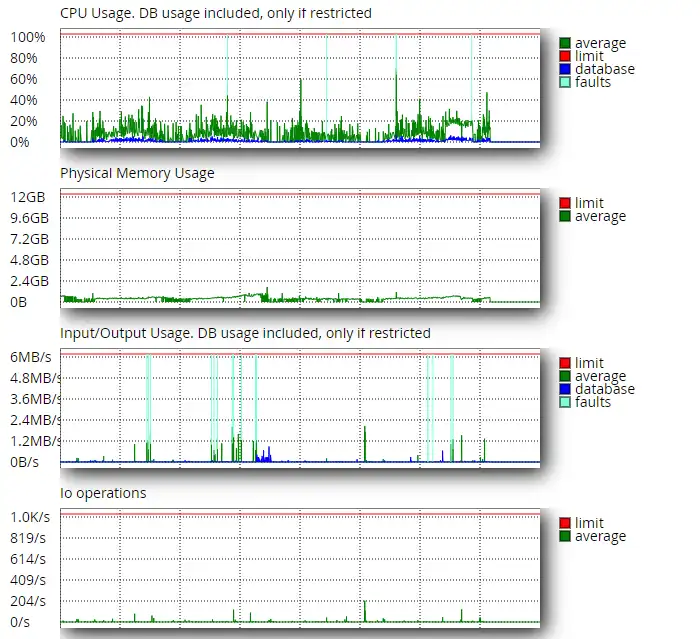
To better understand the different graphs, follow the explanations below for each one:
| Graph | Explanations | What causes over-consumption of resources? |
| CPU Usage | The CPU consumption of your hosting | This mainly concerns the PHP processes run by your websites when a visitor browses your website. If you use other languages such as Node.JS or Python, these are the processes linked to these scripts. Although e-mail processes are also counted, it is extremely rare for them to cause CPU resources to be exceeded. |
| Physical Memory Usage | The RAM memory consumption of your hosting |
This is theRAM memory linked to your package. This rarely poses a problem. All scripts consume more or less RAM memory when they are executed (the memory_limit value defines the maximum amount of memory that a PHP process can use). Heavy processing such as product declinations or data import/export may consume more memory. The same applies to dependencies such as Composer. |
| Input/Output Usage | Read/write operations to disk on your hosting | Most of the time, I/Os are generated by processes that manipulate files on your hosting, and this is often the case when files are backed up. They can also come from your site's cache in the form of files. In short, this concerns everything that needs to read and write to your hosting's disk space. |
| Entry Processes | Number of active connections on the web server for your account. | Each new request creates a child process on the Apache web server (child worker). It is then closed when the request has been fulfilled. The "Entry process" quota indicates the maximum number of Apache processes that your formula can accept.) This means that if you have a page that takes a long time to load and is heavily used, your Entry Process may be saturated. Too many visits could also saturate this quota. |
| Processes | Number of processes running | Processes are the binary files running in the environment of your hosting package. This includes PHP, NodeJS, Python, etc. processes that are used to serve your visitors, but also processes running on the SSH terminal of your package. |
The"Snapshot" tab allows you to capture the processes that were running on your web hosting when one of the values (I/O Entry processes, processes, etc...) was exceeded. This allows you to see which scripts are running, for example, when a CPU overrun occurs.
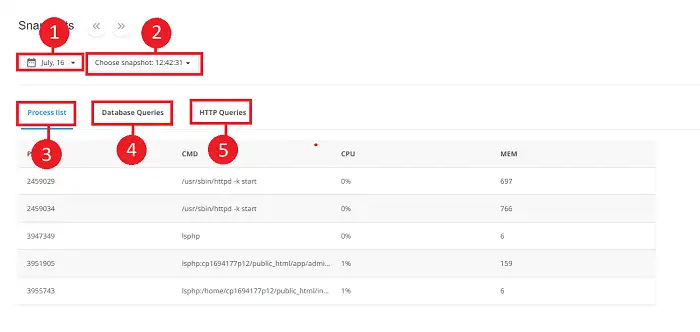
There are several things you can view in the snapshot tool:
It may happen that you reach the limit for certain values. You can see this by going to CPU usage and clicking on"Current Usage". The first thing to do is to check whether the usage visible on the graphs seems consistent with the site you are hosting on your package.
For example, if you're hosting a website with a huge number of visitors, you may be capping certain values, such as CPU, in order to be able to respond to each visit. In this case, you will certainly need to check whether it is possible to optimise your website.
To do this, you need to ask yourself the following questions:
On the other hand, your site may not have many visitors but its CPU, memory or IO consumption is regularly skyrocketing. In this case, you'll need to check the following:
It may also be due to the number of sites hosted on your web package. You may have several dozen active websites on your package andone or two of them are consuming all your resources. In this case, it may be necessary to see whether subscribing to a second package and migrating some of the sites on it could balance the load.
However, this won't work if you only have one site on your web hosting or if you have several websites and the consumption problem only concerns one of them.
Below is a summary table of things to check if you have a problem with CPU, memory or disk access on your hosting.
| Problem | To check | Help / Comment |
| Abnormal CPU consumption | Are you using the latest version of PHP? | PHP 5.6 is 3 to 4 times slower than PHP 7. Check that you are using the latest PHP version by going to "Select a PHP version" on cPanel. |
| Abnormal CPU consumption | Isopcache active? | opcache makes a huge difference to PHP performance. You can check that it is active by going to the "Select a PHP version" tool on your cPanel interface. |
| Abnormal CPU or IO consumption | Do you have cron tasks or other operations running at regular intervals? | Cron jobs are often heavy tasks, such as generating a backup. As a result, they can consume a lot of CPU. It should also be noted that some CMS such as Wordpress have their own cron tasks such as wpcron. If you have cron jobs running every minute, it's a good idea to check that you don't have the option of increasing the time between runs. |
| Abnormal CPU or IO consumption | Do you make backups? If so, when are they launched? | If you make automatic backups of your site, it's best to run them at off-peak times. |
| CPU consumption | Have you made any major changes recently? Have you installed something new or made an update? | Try to go back over the major changes that may have been made to your hosting or when you installed certain plugins. It is quite possible that the problem occurred after a modification to your site. |
| CPU consumption | Do you have more visitors than usual? | Take a look at your statistics tools, such as AWStats, to check the number of visitors. Also check that no robots or automated systems are visiting your site. |
| CPU consumption | Do you have a cache system on your site? | If you don't have a cache system on your site, you may need to install one. This could be in the form of a plugin such as WP Rocket or WP Fastest Cache or a server cache(Fastest Cache or Litespeed). |
| CPU consumption | Have you checked your site for hackers? | Malicious processes can cause your hosting toconsume too much CPU. Log on to your hosting and look through your files for any suspicious names. You can also run an online antivirus scan. |
| Abnormal IO consumption | Do you have a cache directory on your site? Have you purged it? | A cache stored in the form of a file can be counter-productive and generate massive IO if it is not purged. |
| What does it matter? | Are you using the latest version of the CMS, extensions or themes? | If you're not using the latest version of the CMS, extensions or theme, check whether it's possible to carry out an update. Updates fix problems, including performance issues. |
| What does it matter? | Have you looked at the error logs for your application or PHP? | If your application generates a log file, open it to check the latest errors. Activate and check PHP errors too. |
Resource overrun is often due to a problem with the optimisation of a site or a script. As we have seen in this help, it is possible to view resource graphs (CPU, Memory, IO, Processes) on your web hosting. Snapshots allow you to view an image of the processes active on your formula at a given time.
Rate this article :
This article was useful to you ?
Yes
No
1mn reading
How do I program a Cron task in cPanel?
0mn reading
How do I connect to cpanel via SSH using putty?
1mn reading
How do I resolve the ERR_CONNECTION_REFUSED error on cPanel?
1mn reading
How can I use WP-CLI to manage my WordPress instance on cPanel?
Bonjour,
Je vous remercie pour votre retour.
Navré qu'une mauvaise interprétation ait eu lieu.
La consommation MySQL s'exécute hors LVE et sans dépassement, donc pas affiché dans le graph. Une fois que le MySQL est bridé, il s'exécute dans le LVE et cela est donc graphé, jusqu'à ce qu'il soit débridé.
Le reste des services (PHP, Apache…) s'exécutent toujours dans LVE donc toujours graphés.
Je vous remercie pour votre attention et reste à votre disposition pour toute autre question ou complément d'information. Vous pouvez contacter le support technique depuis votre espace client au besoin.
Cordialement, L'équipe LWS.