Rate this article :
2.5/5 | 2 opinion
This article was useful to you ?
Yes
No
Vous avez noté 0 étoile(s)
Sommaire
Procédure
When you try to visit a website and you see the error message "500 Internal Server Error", this means that something has gone wrong with the website. The error can be particularly frustrating as it may not give you any information about the specific cause of the error. This article shows you how to debug a 500 error on your website.
A blank page is not necessarily a 500 error, and vice versa. A 500 error means that an error has occurred during the processing of the HTTP request. This could be an error in executing the associated script, a problem accessing a resource, etc. which causes the web server to return a response with the error code 500. A blank page, on the other hand, means that the web server has not returned any bodies in its response, or even no response at all.
In some situations, a 500 error means that the web server has no response to make, and therefore causes a blank page. This is possibly the case when no 500 error page has been configured, or also if error output has been disabled and so the site has no error message to mention.
Some browsers such as Chrome and Internet Explorer display their own 500 error page when they receive the HTTP header error code without the server providing any content in the body of the response:
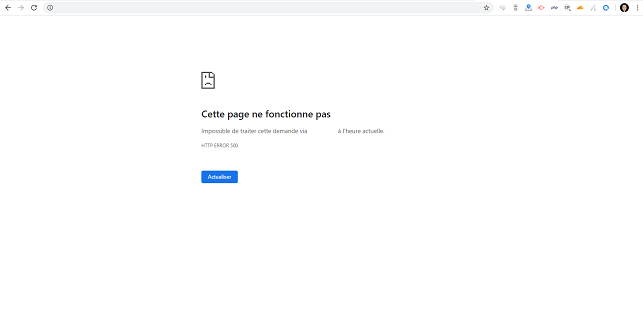
500 errors are often linked to a problem with one of the .htaccess files acting on the URL, or a PHP error. So, by activating error display with the php.ini display_errors option, you should see PHP errors appear instead of the 500 error.
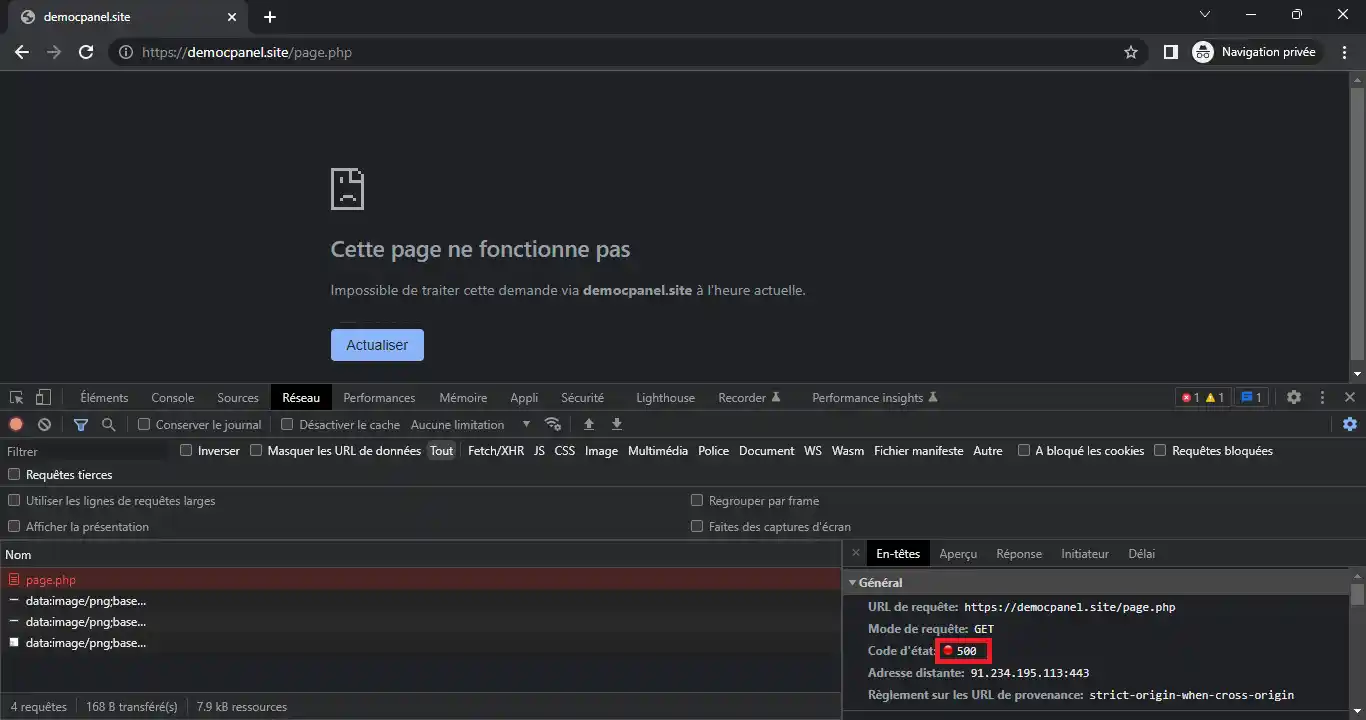
To determine whether you have a 500 error, you need to look at the HTTP error code returned by the web server to your web browser. This can be identified using the "Network" tab in your browser's developer console:
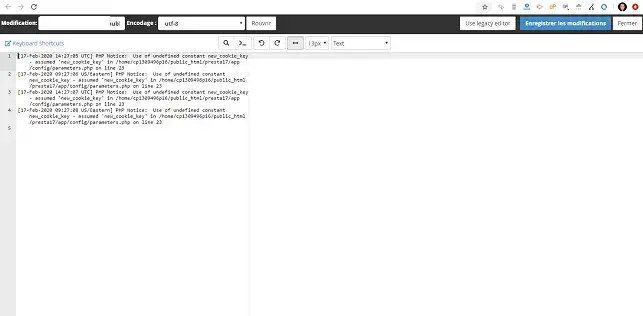
The first thing to do is check the log files associated with the HTTP request: the Apache log file and the PHP log file. The last 300 events concerning you in the Apache log file can be consulted from the 'Errors' icon on your cPanel interface, while the PHP log file is generally the 'error_log' file visible next to the PHP file concerned:
However, it is possible that errors are not displayed in the logs. This may be the result of a configuration that prevents PHP errors from being displayed and/or logged. Find out more.
However, if you are using WordPress, Prestashop or Joomla, it is quite possible that no changes will be visible. In this case, you will need toactivate error display in their respective configuration files .
Most CMS such as WordPress have an internal error handling system, which prevents the PHP parameters in place from processing and taking action depending on the error encountered. By activating debug mode, you are asking this internal error management system to display errors and/or increase the verbosity of the log files.
To activate debug mode, you can connect directly to the"File Manager" accessible from your cPanel interface and edit the associated configuration file to activate this mode.
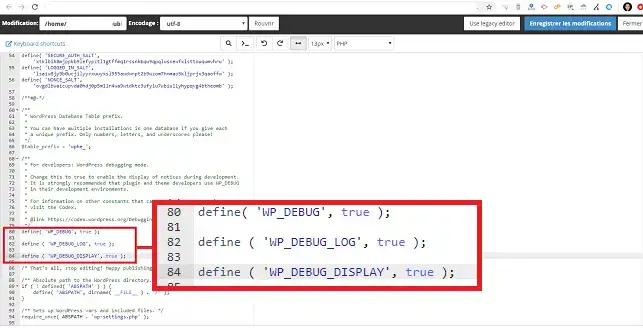
If your site was created with WordPress, you can activate debug mode from the"wp-config.php" file at the root of your web hosting. To do this, simply change the constant"WP_DEBUG" to"true" instead of"false".
If you wish, you can also add the WP_DEBUG_LOG constant to record errors in the"wp-content/debug.log" file.
You should also check that the"WP_DEBUG_DISPLAY" constant is not defined in your configuration file. If it is, you will also need to set this value to true.
The configuration file should look like this:
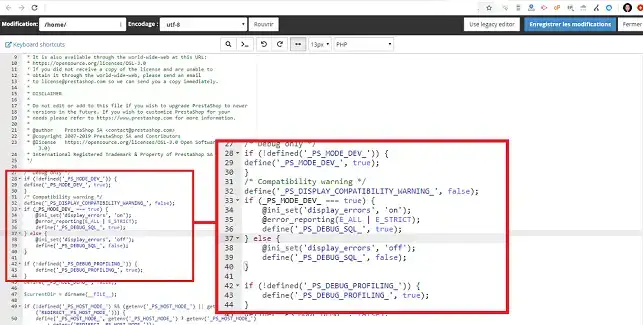
On Prestashop, you can activate debug mode by going to the"define.inc.php" file in the"config" folder.
You will need to change the "_PS_MOD_DEV_" statement to"true" instead of"false". If necessary, you can also activate the"_PS_DEBUG_PROFILING_" mode, which will give you more information.
The configuration file should look like this:
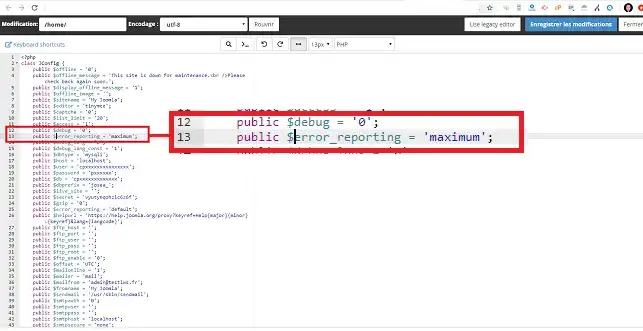
For Joomla, you can activate debug mode by editing the configuration.php file. In this file, you need to change the"$debug" variable to 1 to activate it. You also need to change the $error_reporting variable to"maximum" so that all errors are displayed.
The configuration file should look like this:
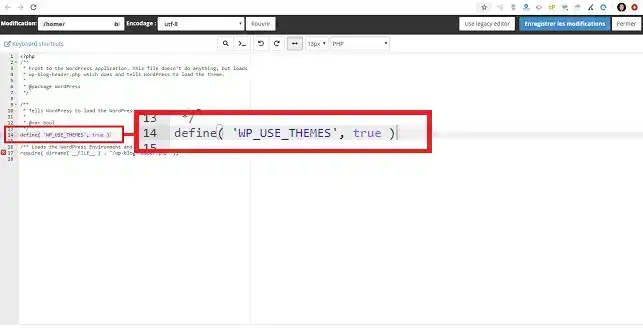
You may well be using another CMS. To find out how to activate debug mode, you can also type"CMS name + Debug" into the search engine. This should take you straight to a tutorial explaining how to activate this mode.
It is relatively easy to understand the origin of a 500 error, as it is very often the same errors that recur.
1. The first and most common error is the"Parse error". This often indicates a syntax problem (an error in the programming of your code). The error is defined as follows:
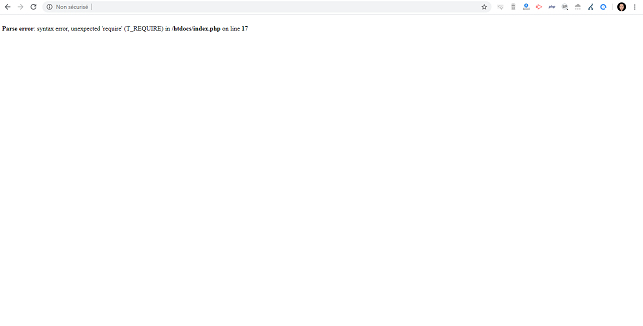
If we take the example of the index.php file on our Wordpress site where a semicolon is missing at the end of line 17, the Web file where the error is found is as follows:
The error visible when you go to the URL will be as follows:

2. The error"Parse error: syntax error, unexpected end of file" indicates that something seems to be missing at the end of the file.

In this code, for example, the brace closing the if statement is missing.
3. Parse Error: syntax error, unexpected (T_STRING), expecting ','or'; ' is often due to an error related to the quotation mark in your code.

In this code, the backslash on the word "error", as in the following code, is missing to make it work:

4. You can also see an error of the"Fatal Error" type. This is one of the most serious errors you can encounter. It also causes your script to stop. It is defined as follows:
This error often indicates that a function has not been defined, as in the following code:

You will therefore see the following error: Fatal Error: Uncaught Error: Call to undefined function
This error is often due to one of the following:
5. It is quite possible that you will get a"Fatal Error: cannot redeclare" error indicating that the function has been defined a second time. The code could look like this:

It is quite possible to avoid this error by:
6. You may receive the error"Fatal Error: allowed memory size exhausted".
This indicates that the PHP script is using too much RAM and exceeds the maximum value authorised on PHP.INI. This is the "memory_limit" value. You can change this value in the cPanel formulas. If, despite increasing the value to a sufficiently high level, the problem persists, it may be that an operation consuming a lot of memory is being repeated too often (or even ad infinitum) in your PHP script. Infinite loops are also possible causes of this type of error.
7. The"Fatal Error: Maximum execution time exceeded" error means that the execution time of your script has been exceeded. You can modify the"max_execution_time" value in your PHP.INI configuration. Note however that any process running for more than 490 seconds is not allowed on our cPanel shared hosting packages, but above all that if a page requires a higher max_execution_time, this would also mean that it would load more slowly, which is generally not desirable. If the page that has generated this error processes a lot of data, we advise you to carry out batch processing. For example, instead of processing 1000 products each time the page is opened, it would be more appropriate to process batches of 100 products, using AJAX requests, for example. And you'll get a lower TTFB (Time-To-First-Byte).
8. The error"Fatal error: Uncaught Error: Call to undefined function mysql_connect()" means that the"mysql" module is not loaded on the PHP version you are using. The error occurs when:
You can easily change the PHP version by going to"Select a PHP version" on your cPanel interface.
9. The"Permission denied" error means that PHP does not have the rights to access a defined file or folder. This error can often be seen in the following form:
Warning file_put_contacts(/home/c123456/public_html/dossier/file.php): failed to open stream: Permission denied in /home/c123456/index.php on line 20
In this case, you need to check the chmods on your files and folders. In principle, the chmods are as follows:
10. The"No such file or directory" error indicates that PHP needs to include a file that does not appear to be present on your FTP space. The error represents the following:
Warning: require_once(/home/c123456/public_html/dossier/fichier.php): failed to open stream: No such file or directory in /home/c123456/public_html/index.php on line 20
In this case, you need to :
11. You may see the error"Warning:session_start(): Cannot send session cookie headers already sent" which indicates that a stream has already been generated and that it is therefore no longer possible to use the"session_start" function. This error can be seen in the following form:
Warning: session_start(): Cannot send session cookie - headers already sent by (output started at /home/c123456/public_html/dossier/session.php:2 in /home/c123456/public_html/dossier/session.php on line 20
The 3 possible causes of this error are as follows:
You can now find out the reason for a 500 or blank page error. You can also troubleshoot your website.
Don't hesitate to ask your questions and/or make comments.
Rate this article :
2.5/5 | 2 opinion
This article was useful to you ?
Yes
No
3mn reading
Wordpress on cPanel: Solving the white page or 500 error problem
1mn reading
How to view Apache and PHP log files on cPanel
0mn reading
How do I correct a 403 Forbidden error on cPanel?
0mn reading
How do I correct a 404 error on cPanel?