Rate this article :
5/5 | 1 opinion
This article was useful to you ?
Yes
No
Vous avez noté 0 étoile(s)
Sommaire
Procédure
xDebug is a PHP extension used to debug sites. Among its features, it can be used to identify the source of slowness on a website.
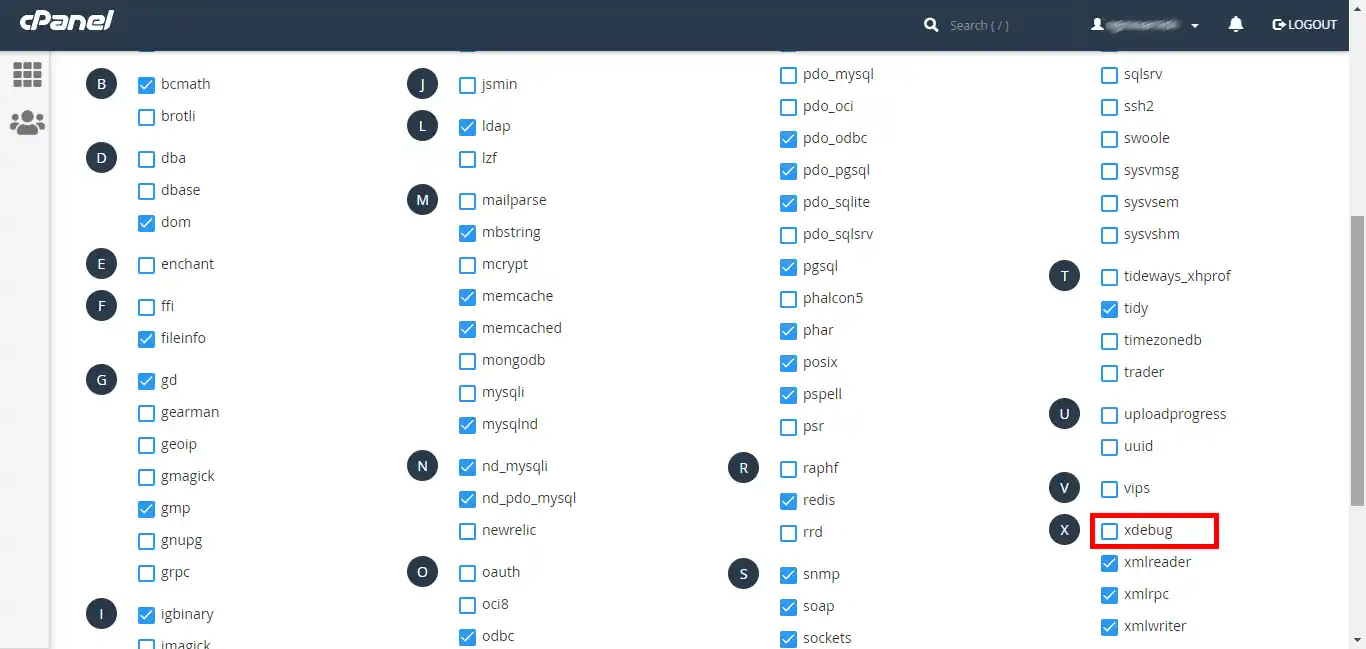
From the PHP extensions selection tool in your cPanel control panel, activate the xDebug extension:
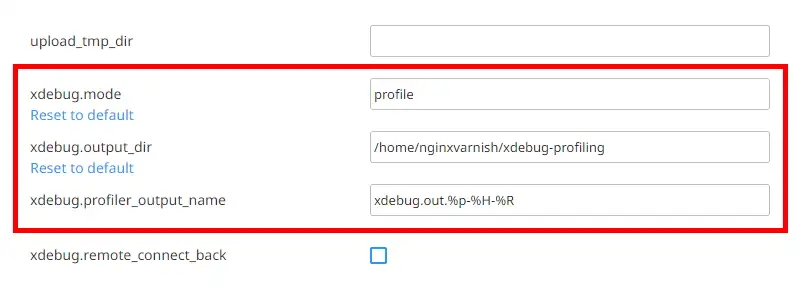
From theOptions tab, enable xdebug permanent profiling:
Once these settings are in place, go to the page you wish to profile in order to generate the profiling data. If all has gone well, you will see a new file in the folder you specified:
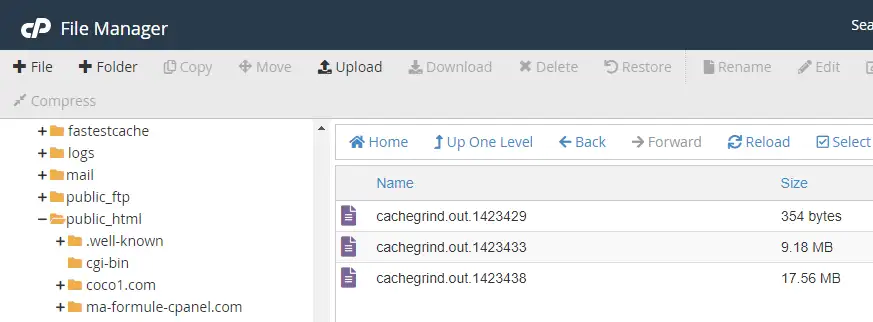
Each file will correspond to an HTTP request made.
Once you have obtained your xDebug profiling file, install Webgrind on your hosting package to read its contents. To do this, download Webgrind and unzip it to a folder in your FTP space:
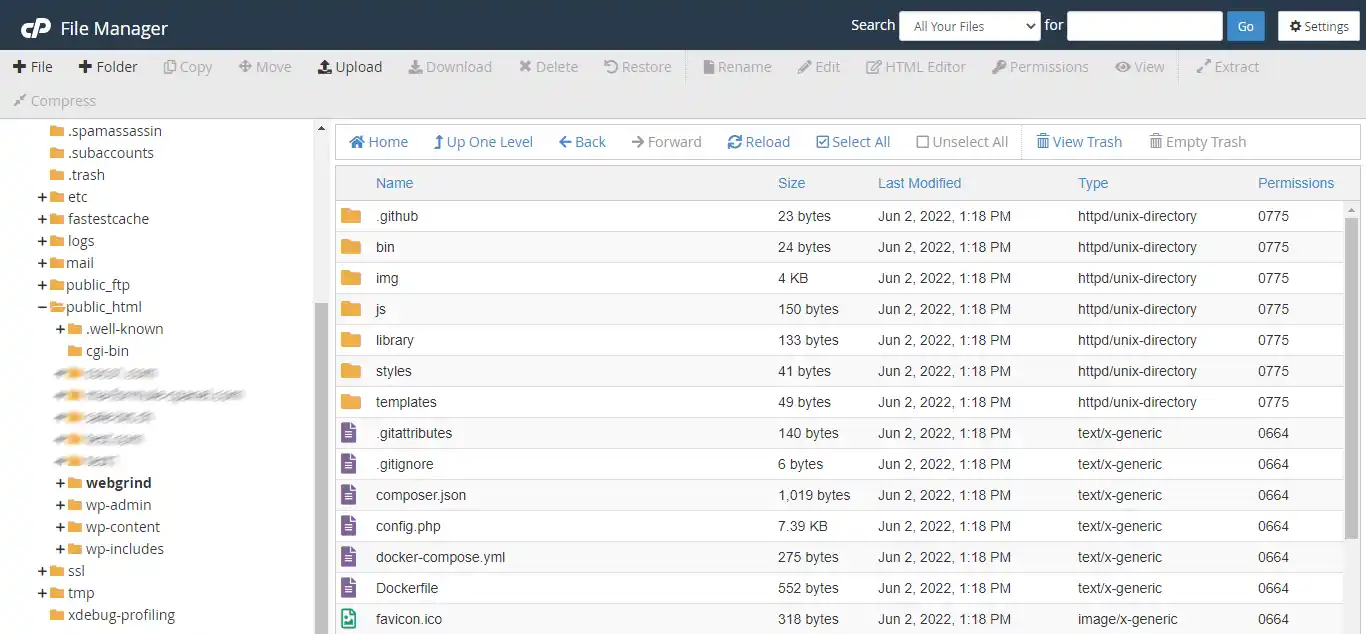
Then edit the config.php file to enter the path to the xdebug profiling files:
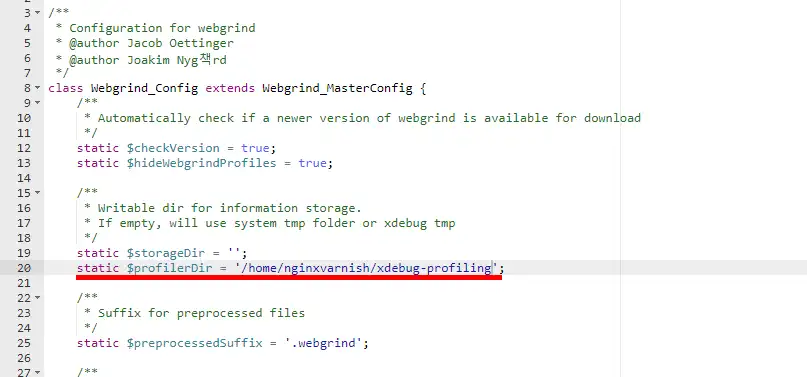
Then go to the URL https://www.votresite.com/webgrind (depending on where you have installed webgrind) and select a profiling event to open and click on"Update":

Once the file has been loaded, you will see a table like the one below:
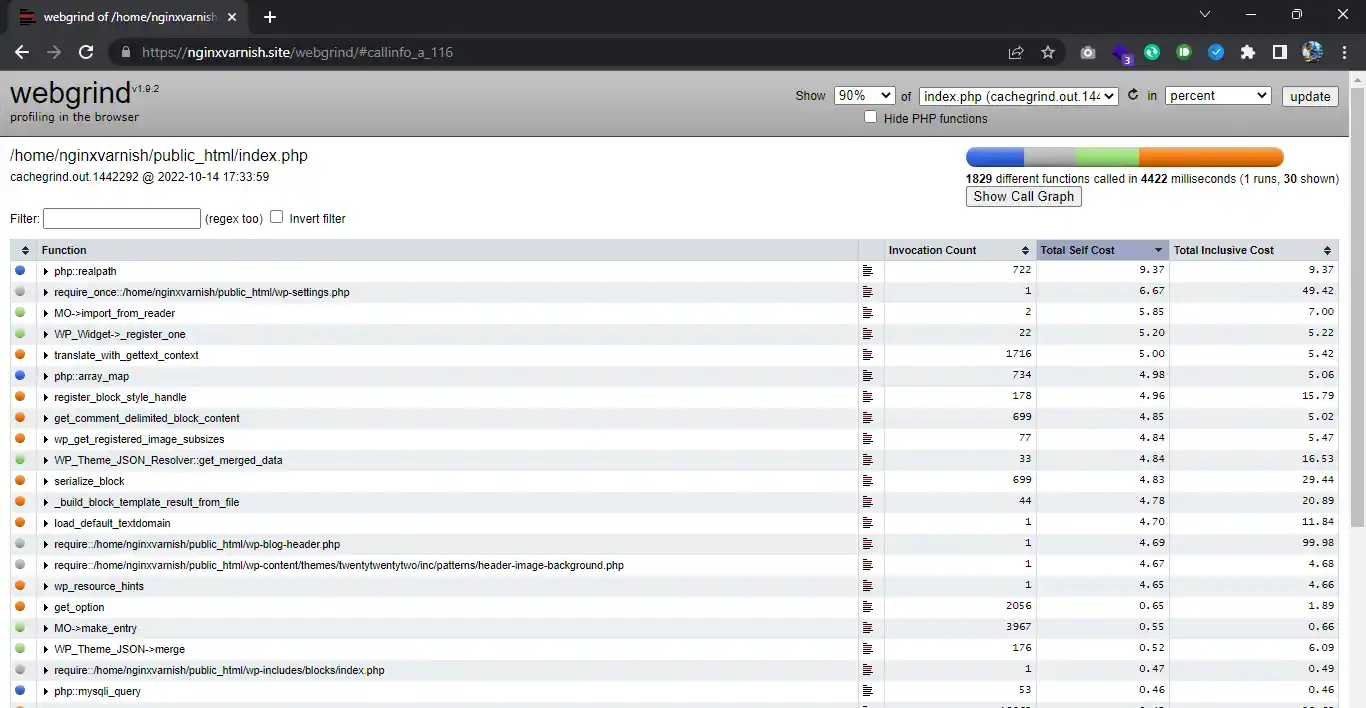
The most important columns are: the function column which indicates the PHP function called, invocation count the number of calls made to it, total self cost the total time spent using it. You can then easily identify in the table the PHP functions that are causing your website to be slow, and modify the site to improve its performance.
Rate this article :
5/5 | 1 opinion
This article was useful to you ?
Yes
No
1mn reading
How do I configure Cloudflare on a website hosted on cPanel?
3mn reading
How do you use Memcached on your cPanel website?
4mn reading
Using Redis as a persistent object cache for WordPress on cPanel
4mn reading
Speed up your site with Fastest Cache - Cache Varnish